Consistency at Scale with Systems Thinking
- Udit Khandelwal

- Dec 8, 2020
- 7 min read
Updated: Oct 4, 2023
Scaling up is easy. Maintaining quality is not. How to ensure UX consistency with growing number of teams? How to scale up a design system cross functionally? How to set higher standards dynamically to maintain quality?

Fast-paced organic growth of a company produces some adverse side-effects. Companies end up passing the burden of growth to the user. Experience across the portfolio of products or services offered by a same company becomes fragmented, resulting in immense intellectual load, memory load and frustration for the user. However, if we try to understand this organic growth, interaction between the various actors involved in this growth, we could come up with tweaks that can help us optimize the system. Loosely put, this is systems thinking.
What is Systems Thinking?
Systems thinking is all about seeing the relationship between the structure of those systems and the behavior that those systems exhibit, so we can:
Understand how those systems work.
Diagnose what makes them produce poor results?
Shift them into better behavior patterns to improve performance or achieve our goals.
Systems Thinking is a tool that allows you to engage in conversation about ways to improve performance I’ll try to explain this using two prime examples. One is a typical textbook example and the other one is my application of systems thinking while I was trying to build an ecosystem.
Causal Loop Diagram
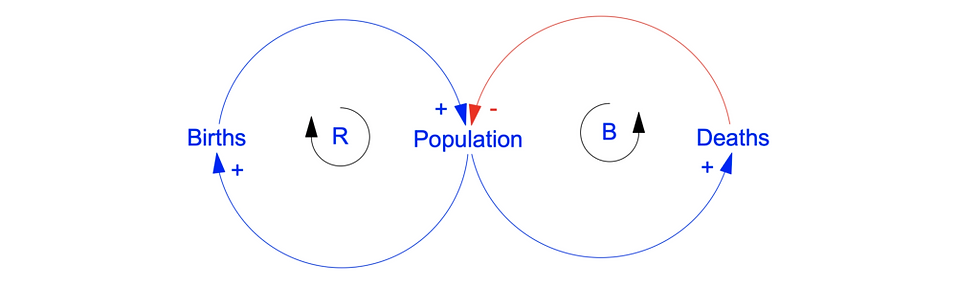
Population Growth – Causal Loop Diagram
Causal loop diagrams are commonly used to illustrate complex systems. Here, we are considering a population, which has a positive relationship with birth, which means if population goes up birth go up, as there are more people reproducing. And when births goes up, the population goes up as well. And, on the other hand, we have deaths, so when there are more people there will be more deaths and when there are more deaths there will be fewer people. So in this case, death has a negative relationship with population. So we are seeing two feedback loops here:
On the left is a positive or a reinforcing loop. The loop’s direction is clockwise in this case, and it’s denoted by R for reinforcing.
On the right is a negative or a balancing loop. The loop’s direction is anti-clockwise in this case, and it’s denoted by B for balancing.
Let’s try to add a little more complexity to this:

Causal Loop Diagram – Population Growth Rate
So on the right I have mortality rate. Mortality rate has a positive relationship with deaths, which means higher the mortality rate, higher will be the deaths. Similarly, on the left I have birth rate. Same positive relationship. Now let’s consider a problem. How can you increase the population (or workforce) of a country? Well, looking at our model, we have two main levers here: one birth rate, the other one mortality rate. So let’s see how can we increase the birth rate, maybe incentivize the births. Or penalize abortions, make them illegal. Another way could be decrease mortality rate, by improving healthcare maybe.
Just by drawing the model and by understanding its working, we could consider different levers to optimize the underlying system. That’s Systems Thinking.
So let’s try to consider a real world example next. Something that I have been working on for a couple of weeks:

athenahealth Marketplace
A Real-world Complex System

Let’s consider a real-world complex system – an ecosystem. athenahealth Marketplace is a program where athenahealth’s clients (hospitals) can easily shop for apps and services that will seamlessly optimize their experience to better address their specific needs. athenahealth partners (software development companies) build these apps are built on top of athenahealth Platform.
So in the marketplace we have around 400 apps or plugins. More is the number of apps, more is the number of clients that are attracted to athenahealth. So apps have a positive relationship with clients. More clients to serve means more partners to attract for business, so clients and partners have positive relationship. More is the number of partners, more is the number of apps we will produce. And hence, we have got a reinforcing loop of growing network as show below:

Causal Loop – Growing Network
More partners, more apps, more apps, more clients, more clients will bring in more partners. Now this won’t grow infinitely in a real world. But for the sake of simplicity, let’s consider this model and let’s continue working with it. Look at the next iteration:

Causal Loop – Growing Usage and Services
More apps and plugins would mean more usage, and more usage would bring in more revenue. More revenue would mean athenahealth can invest to spawn up more teams. Which means athenahealth Platform Services can start supporting more services. Services like SSO for example, or data view or API Access. So now athenahealth can provide more and more services, which are very useful for the partners. They can develop more and more apps and plugins using the advanced platform capabilities. So we have got a couple of more reinforcing loops running here, (i.e. Growing usage Loop, Growing Services Loop)
So far so good, all looks green. Or does it? I think we have a problem of scale here. When we have too many teams and when we are required to support many services, it will cause an inconsistent or a fragmented experience across services. Which means, the number of teams has negative relationship with consistent experience. However, consistent experience has a positive relationship with partner satisfaction, and partner satisfaction has positive relationship with partners. So overall we have got a balancing loop going on here because there is one negative.

Causal Loop – Balancing Loop of Deteriorating Experience
In causal loop diagrams, you will get a balancing loop whenever there is an odd number of negative relationships in the loop.
So more is the number of teams lesser is the consistency in experience. You have a fragmented experience and dissatisfied partners, which in the long term will reduce the number of partners that want to come to Athena, or that might cause attrition as well.
Asking What If?
So what do we do about it? Well, here’s the solution. What if we introduce standards and framework?
Note that my sentence started with what if? That’s what systems thinking does for you. It allows you to look at a model as complicated as this and then ask what if questions?
So I’m asking, what if I introduce components and a robust framework. Look at the figure below:

Causal Loop – Maturing Framework
Let’s say we have teams who start producing these components, and they are required to meet standards. So standards have positive relationship with components more. Like better standards would contribute to better components. Let’s say those components would contribute to having a robust framework. And if we have a robust framework that a lot of teams can use, then the framework itself will support a lot of teams. Think of it as a design system, but with organisms instead of atoms. So now that we have a robust framework in place, it can actually give us consistent experience, partner satisfaction and larger number of partners. So by tweaking our model like this and by introducing standards, and framework could actually make it into reinforcing loops.
Just to make things a bit more concrete for you, here is what I mean. Consider a console where all of these services produced by all the teams are hosted like Service X showcased below:

Console Framework
So all the stuff in teal boxes is basically owned by that particular team, product X team or product Y team? Where is all the stuff in purple boxes is owned by a design systems team or a standard steam or the framework team? The framework would define what the common widgets would look like, like the content management system or common integrations, whereas the individual teams would define their own specific integrations and their own workflows. Now sometimes, they will have a few non reusable components. But a lot of components would be reusable, some would be designed and developed by let’s say this design system team, while others will be community contributed by the service X or service Y. Citing real-world scenario from athenahealth, let’s say service X is API access and then there is interfaces team which has its own development in Chennai. And then there is Data View Team, which has its own development in Bangalore. So we have different geo-locations. Different teams are producing different artifacts, but all of them are being governed by this one particular framework. And, where majority of design or design governance is played by this design system team and this is what I’m proposing. This is what I’m trying to have conversations around.
Challenges and How to Tackle Them
So going back to our model, everything looks green now. That isn’t exactly the case. There are still problems and challenges to solve. With this model or any model for example, and I’ll cover three over here.
Policy Resistance – Arises when goals of actors (teams) are inconsistent with each other
Tragedy of Commons – Abuse of shared resource (framework) without sharing responsibility
Drift to Low Performance – Eroding goals (design) influenced by past performance leading to a reinforcing loop
Policy resistance
We have different teams with different goals of micro goals and each one would be like why should they actually confirm to this model in the 1st place. So maybe a clear definition of larger and more important goals might help an. Establishing the ecosystem is already a part of athenahealth’s vision, so that’s helpful.
Tragedy of Commons
This typically comes when there is an abuse of shared resource. In our case, for example, the shared resource would be the framework and abuse would be no one takes the responsibility to contribute back, which sometimes happens with Design Systems. So how about regulating access and terms of use of the resource? How about saying that you can’t use forge unless you contribute at least one Atom back?
Drift to low performance
Often, over a period, the goals erode. They get influenced by the past performance. One team sees that the other team is cutting corners and it’s OK to cut corners for them as well. So over time it becomes a reinforcing loop where the performance keeps on drifting lower and lower. So a way to tackle this could be let standards be enhanced. By better performances rather than going the other way around. I have included it in next iteration of the model. What if better components contribute back to standards? Make newer components of higher quality. So you’ve got improving standards and this way you can take care of quality not going down.

Causal Loop – Improving Standards
Resources
All of the above that I learned was mainly from this course that I took in June 2020 – Understanding and solving complex business problems – MIT Sloan. Thanks to athenahealth’s tuition assistance program!
There are a couple of other resources. This book, Thinking and systems – a Primer, by Donna large Meadows. I love it as it covers all the basics. Then there is super interesting course on Systems Thinking on LinkedIn Learning – It’s from a PhD faculty at Cornell University. It’s a great course and you can run it at 1.5x speed. Happy Learning!
Comment below if you have any feedback or questions.


Comments